The 5-Minute Retirement Plan™
Crafting a meaningful retirement plan becomes quicker and more efficient with the OnPointe Retirement Planner.
Are you in search of a better software solution to streamline the creation of realistic retirement planning scenarios for your clients? Do you find the complexities of using E-Money, Right Capital, Retirement Analyzer, or similar programs tiresome?
Imagine effortlessly incorporating FIAs, FIAs with guaranteed income riders, and even tax-free borrowing from an IUL into a retirement plan with just a click.
Picture being able to instantly communicate the potential impact of a significant stock market drawdown on retirement income.
Would you like your retirement planning software seamlessly integrated with your Investment Risk Analysis software?
If the idea of these features resonates with you, it's time to explore the industry's newest, most powerful, and user-friendly retirement planning software - OnPointe Retirement Planner.
OnPointe Retirement Planner Key Features
Multiple Fact Patterns
Pre-load multiple fact patterns for the client and effortlessly toggle between them during your meeting.
Live Updates
Instantly show your clients the risk of getting a drawback before retirement without spending another hour to create a new plan.
FIA and IUL Incorporation
OnPointe Retirement Planner is the only software that incorporates FIAs, FIAs with income riders, and IUL tax-free borrowing into a plan.
Risk Integration
The integration of our Risk Analyzer allows for a clear alignment between the retirement plan and the risk score.
Industries Best Charts and Graphics
OnPointe Retirement Planner has the best charts and graphs in the industry to help you communicate the shortcomings of a client's retirement plan and how you can fix their shortcomings.
Charts
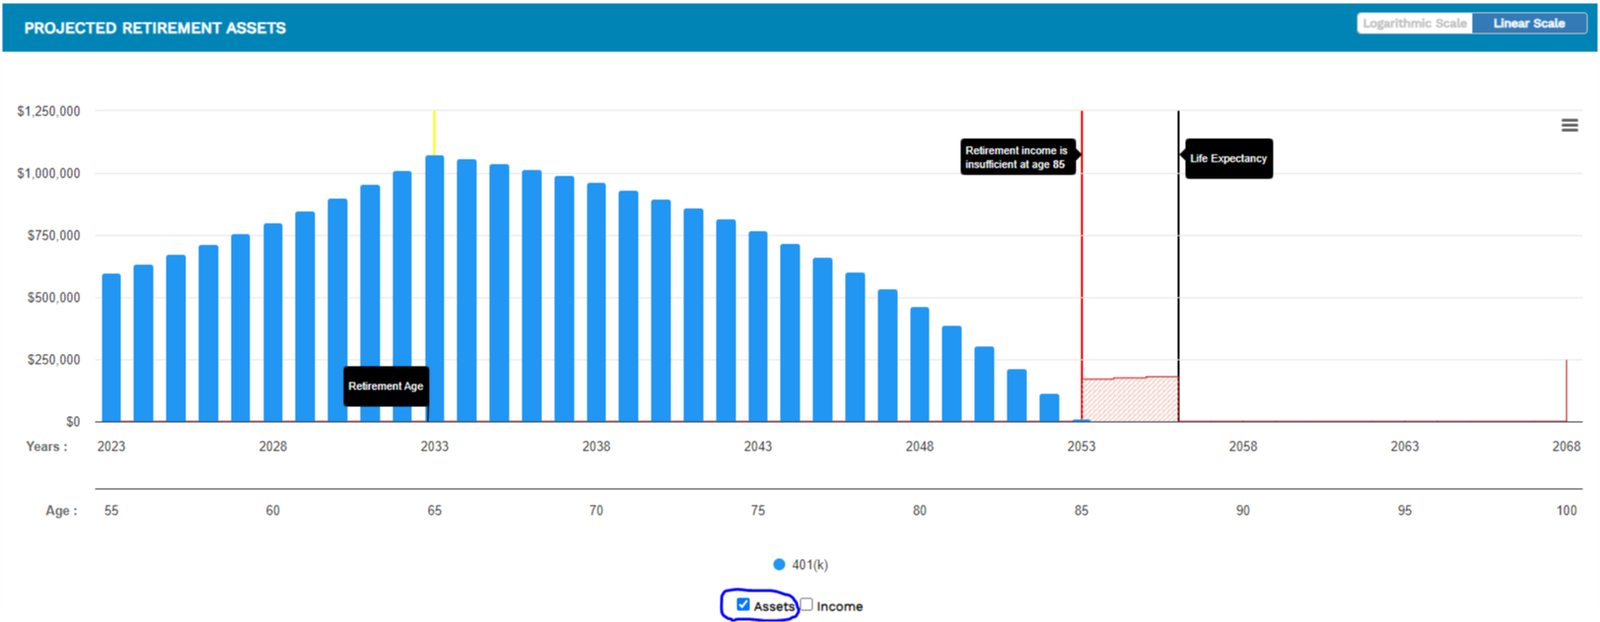
Asset-only charts—some advisors want to show only available assets and when there are shortfalls that need to be fixed.
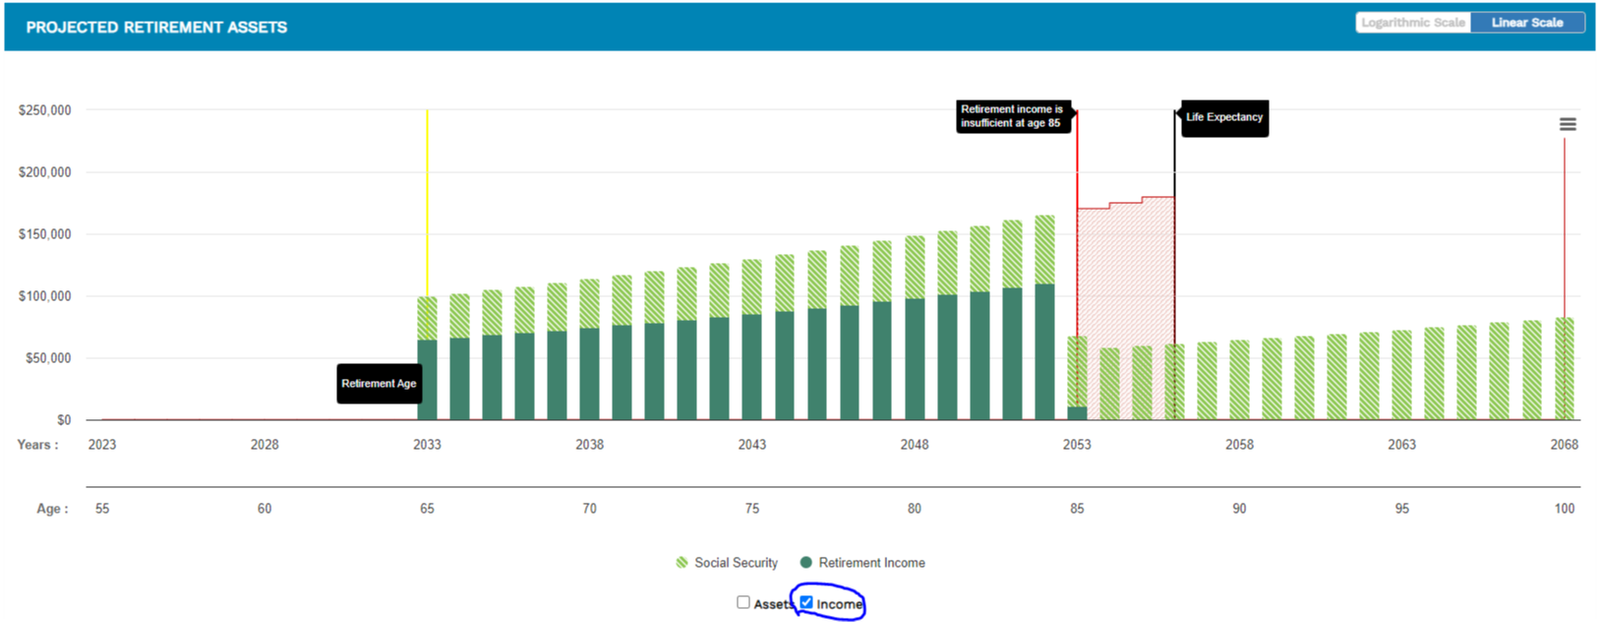
Income-only charts—some advisors want to show only income data and when there are shortfalls that need to be fixed.
Income and asset charts—OnPointe allows users to show income and assets in the same chart.
Charts with guaranteed income benefit (GIB) products pay no matter how long a client lives—using GIB can cure income shortfalls later in life.
Graphics
Run out of money graphics – it’s powerful to be able to show when a client is projected to run out of money in charts and spreadsheet form.
Life Expectancy (LE) graphic – LE in most software is an afterthought. In OnPointe, LE is a key feature used to calculate the “retirement income gap.”
Retirement Income Gap – do you want to pick up new clients? Quickly/powerfully show them how big their retirement income gap is and how your recommendations can eliminate that gap (so clients will have confidence they will never run out of money in retirement).
Our Competitors
Feature
5 minutes or less plan
Simple Charts
Live Plan Changes
Advisor Branding
Risk Integration
FIA/IUL Integration
Training
24/7 Support
No Annual Contract
Monthly Cost
OnPointe
See below
Retirement Analyzer
$80+++ (baseline pricing)
Right Capital
$139.95
eMoney
$216++ (light version)
Cost: OnPointe Retirement Planner
$75 a month for non-securities licensed advisors
$100 a month for securities licensed advisors
OnPointe also offers risk analyzer software that can be bundled for a 25% discount when ordering the Retirement Planner.
Keep It Simple Stupid (KISS) Charts
Asset + Income + Asset Depletion + Life Expectancy + Gap Analysis


If you prefer details in a spreadsheet format instead of charts and graphics, no problem OnPointe has both!
The following illustrates that the client is going to run out of money at age 86 and during that year will have a $32,433 cash flow shortfall. In the years following, the shortfall becomes much worse.
